
February 8, 2026
How to Measure Training Effectiveness and Prove Its Impact

Discover how to measure training effectiveness with practical strategies that prove ROI, improve performance, and link learning to real business outcomes.
Measuring training effectiveness means going beyond just checking a box. It’s about figuring out if the training actually led to new knowledge, changed behaviors, and had a real impact on the business. This means setting clear goals, picking the right numbers to track, and using the right tools to connect the dots between your training investment and business results.
Moving Beyond Completion Rates to Measure Real Impact
Let’s be honest: seeing a 100% completion rate on a training module feels good. It’s a clean, simple metric that suggests progress.
But what does it truly mean for your business? A team can click through every slide and still not retain the information—or more importantly, change how they work.
This is the core challenge so many organizations face. They pour significant resources into training, only to see the same skill gaps stick around, projects stall, and performance stay flat. The frustration is real, especially for managers who see their teams complete company-wide training but witness no noticeable improvement in day-to-day operations.
The Problem with Vanity Metrics
Traditional metrics like completion rates are often "vanity metrics." They look impressive on a report but offer very little insight into whether your program is actually working.
Relying on them leads to a few critical problems:
Wasted Budgets: Without understanding what works, you risk pouring money into programs that don't deliver a return.
Persistent Skill Gaps: Employees might complete training without truly grasping the concepts, leaving critical skill deficiencies unaddressed.
Stalled Growth: When training fails to drive behavior change, the business outcomes you were hoping for—like better efficiency or happier customers—never happen.
To truly move beyond completion rates, you have to shift your focus. A good place to start is thinking about how to approach measuring employee engagement more effectively, as the principles are closely related.
The real goal isn't just to finish the training; it's to apply the learning. Effective measurement builds the bridge between the two, proving that your investment is directly contributing to better business results.
This is where a modern framework for measurement becomes essential. It’s not about ditching simple metrics entirely, but about layering them with deeper, more meaningful data.
Today’s tools, including platforms with robust engagement analytics, make this easier than ever. They provide the data needed to connect training activities to observable behavior changes and, ultimately, to the business results that leadership truly cares about. This guide will give you a practical framework to help you make that connection.
Unpacking The Kirkpatrick Model For Practical Measurement
If you need a reliable way to measure training effectiveness, the Kirkpatrick Model is the gold standard. Developed way back in the 1950s, it’s not just some academic theory—it’s a battle-tested roadmap for answering the big question: “Did our training actually work?”
Think of it as climbing a ladder. Each of the four levels gives you a deeper, more valuable insight than the one before it. You move from simple "Did they like it?" feedback all the way up to tangible business impact. For most teams, this model provides the structure needed to finally connect training efforts to real-world results.
This flow shows how well-designed training—when measured correctly—leads directly to changes in how people work, which in turn drives the performance improvements you’re after.
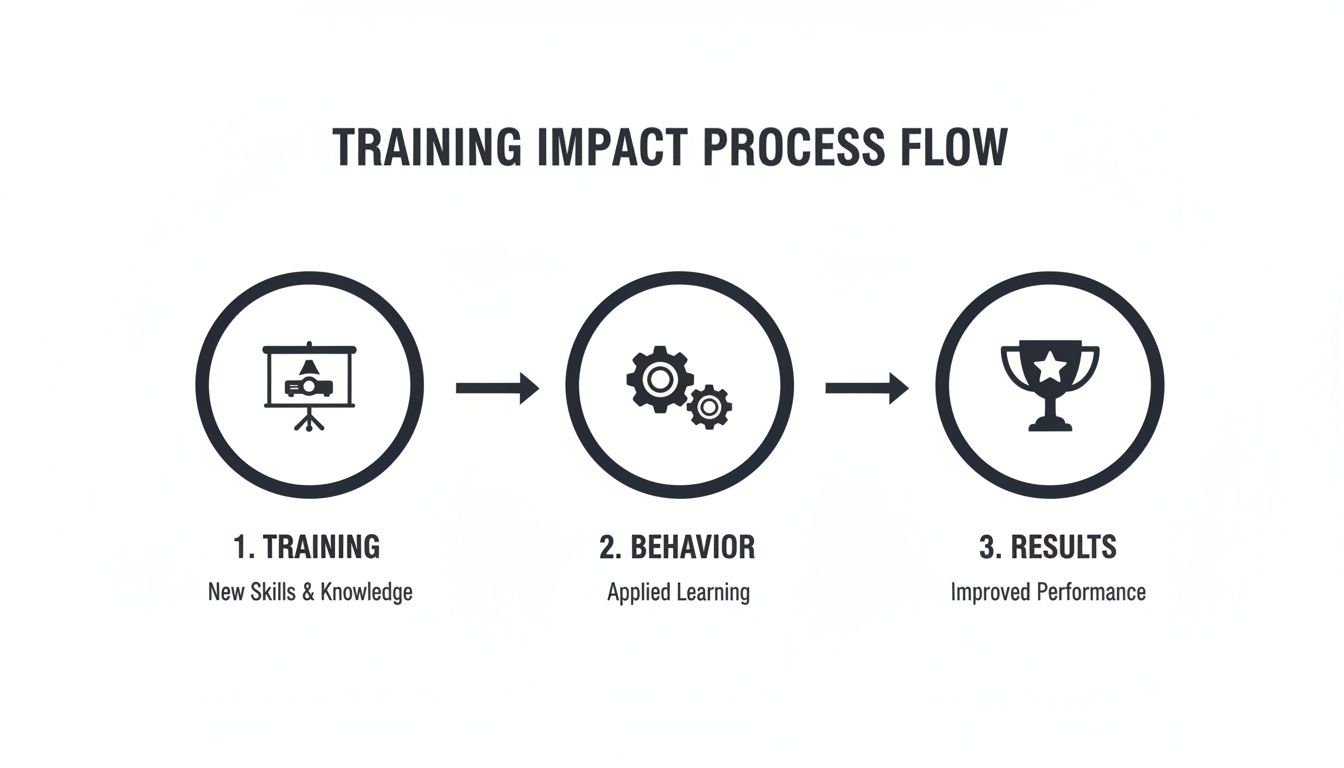
It’s a simple but powerful progression: training leads to new skills, those skills are applied on the job, and that application creates a meaningful business outcome.
To make this framework really click, it helps to see all four levels side-by-side.
The Four Levels of the Kirkpatrick Model Explained
Level | What It Measures | Common Tools | Example Metric |
|---|---|---|---|
1. Reaction | How participants felt about the training experience. | Post-training surveys, "smile sheets," feedback forms. | 85% of participants rate the training as "highly relevant" to their job. |
2. Learning | The degree to which participants acquired new knowledge and skills. | Pre- and post-assessments, quizzes, skill demonstrations. | A 25% increase in average scores from the pre-test to the post-test. |
3. Behavior | Whether participants are applying what they learned on the job. | Manager observations, performance data, analytics from tools. | A 15% increase in the use of a new CRM feature after training. |
4. Results | The final impact of the training on business-level outcomes. | Business KPIs, ROI analysis, productivity metrics, customer satisfaction scores. | A 10% reduction in customer support tickets related to a specific topic. |
Each level builds on the last, giving you a complete picture of your training's impact from initial engagement to bottom-line results.
Level 1: Reaction
The first level, Reaction, is all about gauging how participants felt about the training. This is where those classic "smile sheets" or post-training surveys come in. The goal here is to get an immediate pulse on engagement and relevance.
But we can do a lot better than just asking, "Did you enjoy the session?"
To get genuine insights, your questions need to dig deeper. Try asking things like:
"Which part of this training was most relevant to your daily tasks?"
"What is one thing you will apply from this training in the next week?"
"On a scale of 1-5, how confident do you feel applying these new skills?"
These questions shift the focus from simple satisfaction to perceived value. You’re no longer just measuring happiness; you’re measuring the intent to apply, which is a much stronger indicator. A good target to aim for is 80-90% positive feedback, showing the content hit the mark.
Level 2: Learning
Next up is Level 2, Learning. This is where we measure what people actually absorbed. Did they walk away with new knowledge or skills? Here, we move from subjective feelings to objective data.
The go-to tools for this are pre- and post-training assessments. By establishing a baseline of knowledge before the training, you can accurately measure the "knowledge lift" afterward. An effective program should be able to boost assessment scores by 20-30%.
For instance, an agency using a tool like Build a Guide could test a team on a new software feature. The pre-training quiz might show an average score of 55%. After the team works through an interactive guide, a post-training quiz showing an average of 85% gives you concrete proof of knowledge gain.
Key Takeaway: The best assessments don't just test memorization. They should present real-world scenarios that force learners to apply their new knowledge, proving they can actually use what they’ve learned.
Level 3: Behavior
Level 3, Behavior, is where the rubber meets the road. It asks the most important question: Are people actually doing things differently on the job? This is often the hardest level to measure, but it's where you see if training is bridging the gap between knowing something and doing something.
Measuring behavior means getting out of the classroom and into the workflow.
Direct Observation: Managers or peers can use simple checklists to see if new processes are being followed.
Performance Data: Look at the KPIs that would be affected. For a sales team, this could be the number of CRM entries using a new methodology. For an ops team, it might be a drop in error rates.
Tool Analytics: If your SOPs are housed in a platform like Build a Guide, check the engagement analytics. Are people still viewing the guide for a new process weeks later? High engagement is a great sign they’re using it to change their behavior.
Level 4: Results
Finally, Level 4, Results, connects everything back to the bottom line. This level measures the training's impact on the big-picture metrics that leadership really cares about—things like productivity, cost savings, sales growth, or customer satisfaction.
Let’s say a support team was trained on new client onboarding SOPs. The Level 4 measurement would look for things like:
Time to Onboard: A 20% reduction in the average time to get a new client fully set up.
Client Satisfaction: An increase in NPS scores from new clients by 15 points in their first 90 days.
Support Tickets: A 30% decrease in "how-to" questions from new clients, proving the onboarding was more effective.
The Kirkpatrick Model has remained the gold standard for a reason—in fact, 71% of organizations still use it to structure their evaluations. Companies that rigorously apply all four levels see much higher performance gains. By moving through each level, you build a powerful story that proves your training isn't just an expense—it’s a strategic investment.
For more on this, Docebo.com offers some great insights into measuring training effectiveness and understanding its progressive levels.
Choosing KPIs That Align with Business Goals
Measurement is meaningless without the right metrics.
This is the step that connects your training programs to what leadership actually cares about—tangible business results. It means moving beyond simple learning stats and picking indicators that tell a compelling story of value.
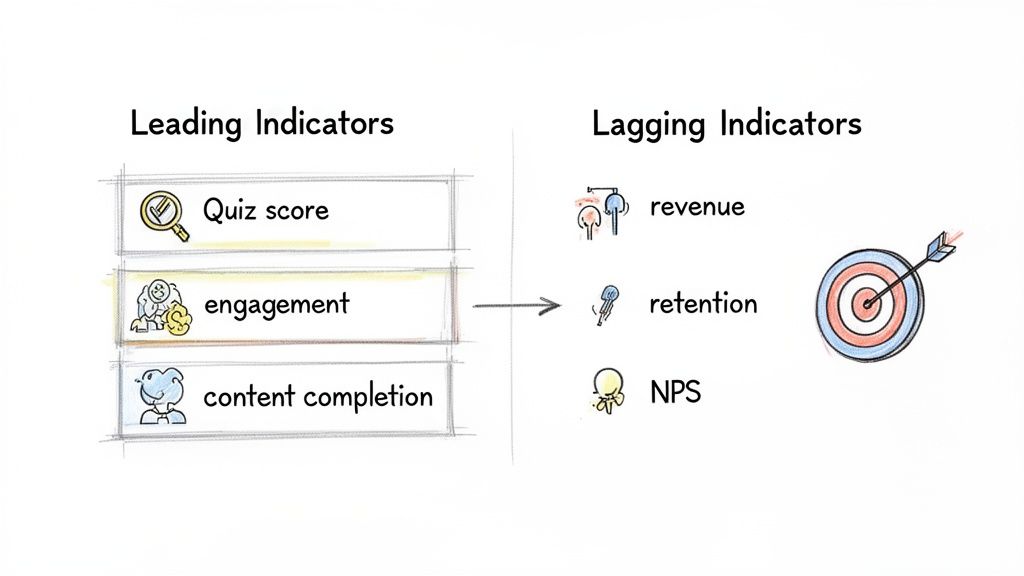
A powerful way to think about this is to split your metrics into two camps: leading indicators and lagging indicators. Each plays a distinct but equally important role.
Leading Indicators Predict Future Success
Leading indicators are your early-warning system. They are the forward-looking metrics that predict whether you're on the right track by measuring immediate engagement and knowledge gain.
Think of them as the inputs that drive future outcomes. They're often easier to collect and give you quick feedback, letting you make adjustments on the fly.
Examples of strong leading indicators include:
Quiz Scores: Are people actually learning what you're teaching? A pre- vs. post-training assessment gives you a direct answer.
Content Engagement: How often are learners interacting with your materials? If people are still viewing interactive SOPs created in Build a Guide weeks after training, you know it's a valuable job aid.
Skill Application in Simulations: Can employees apply what they’ve learned in a controlled, safe environment?
Confidence Ratings: A simple pre- and post-training survey asking learners to rate their confidence can reveal a lot.
These metrics don't prove bottom-line impact on their own. But they are essential for diagnosing why a program is or isn't working. If your leading indicators are weak, it’s a safe bet you won’t see the long-term results you’re hoping for.
Lagging Indicators Prove Business Impact
Lagging indicators are the backward-looking metrics that prove your training delivered on its promise. These are the results-oriented KPIs that directly tie back to business performance.
While they take longer to measure, they provide the definitive proof of your training's ROI. These are the numbers that get executives' attention because they speak the language of business—revenue, costs, and efficiency.
Key Takeaway: You can't just measure one or the other. Leading indicators tell you if the learning is happening. Lagging indicators confirm that learning is translating into real business value. A strong measurement strategy tracks both.
Common lagging indicators tied to business goals include:
Revenue Growth: For a sales team, this could be a shorter sales cycle or an increase in average deal size.
Employee Retention: Did turnover rates drop for roles that went through your new onboarding program?
Customer Satisfaction (CSAT/NPS): A jump in customer satisfaction scores after a support team training initiative is a huge win.
Productivity Gains: A reduction in task completion time or a drop in error rates is a clear sign of impact.
Aligning KPIs with Specific Business Objectives
The best way to choose KPIs is to work backward from a specific business goal.
Start by asking, "What problem is this training trying to solve?" Then, identify the metrics that will prove you've actually solved it.
Let's walk through a real-world example. Imagine the company's goal is to increase customer loyalty. A training program is rolled out for the support team focused on improving first-contact resolution. If you want to learn more about standardizing these kinds of workflows, check out our guide on process improvement best practices.
Here’s how you would align your KPIs:
Business Goal | Training Initiative | Leading Indicators | Lagging Indicators |
|---|---|---|---|
Increase Customer Loyalty | New SOPs for support team on issue resolution. | Higher quiz scores on new troubleshooting steps. Increased views on the SOP guides. | 15% increase in First-Contact Resolution rate. 10-point increase in NPS scores. |
This clear alignment creates a direct line between the training activity and the desired business outcome. When you can show data proving that improved knowledge (leading indicator) directly led to happier customers (lagging indicator), you've built an undeniable case for your program's value.
How to Collect and Analyze Training Data Effectively
Once your KPIs are locked in, the next hurdle is getting the data to actually measure them. Good data is everything, but collecting it well means blending the numbers (the "what") with the narrative (the "why").
This is about more than just blasting out a survey after a session. You need a strategy that tells the whole story: where the team started, what they actually learned, if they're using it, and—most importantly—what it all means for the business.
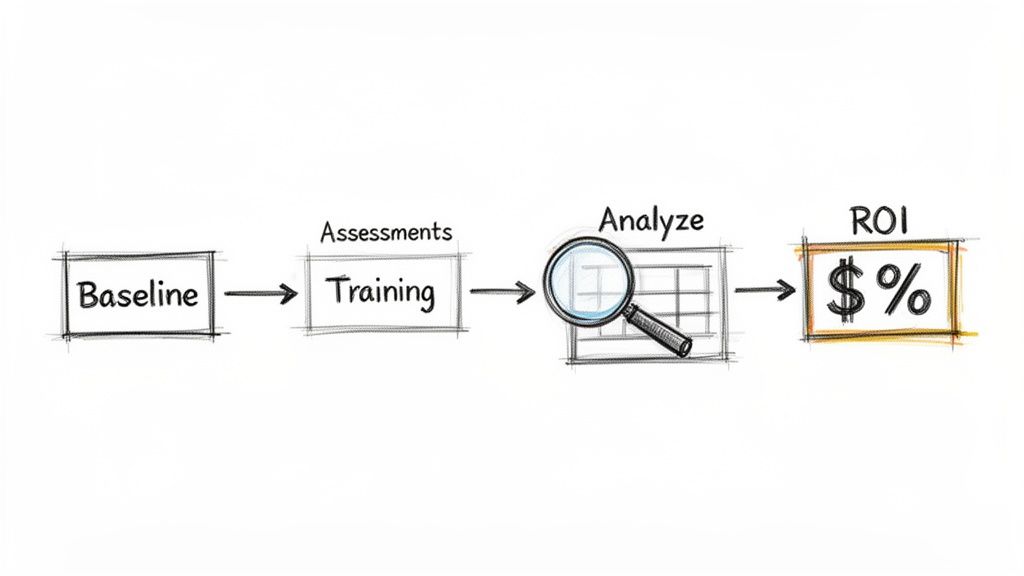
Establish a Baseline Before You Begin
You can't prove you've moved the needle if you don't know where it started. This is probably the most overlooked step in the whole process, but it's the one that gives your results credibility. A baseline is just a snapshot of performance before anyone even sees the training material.
This pre-training data is your benchmark. It's the "before" picture that makes the "after" picture meaningful.
A few straightforward ways to set a baseline:
Pre-Training Assessments: Give everyone a quick quiz or skills test to see what they know right now.
Performance Metrics: Pull the numbers for the KPIs you're targeting. If you're training a sales team on a new CRM, look at their current data entry error rate or average time to close a deal.
Manager Observations: Ask managers to rate their team members on the specific skills the training will cover. A simple checklist works wonders.
Key Takeaway: Without a baseline, any improvement is just a happy coincidence. You have no real proof that your training—and not something else—caused the change.
Combining Quantitative and Qualitative Data
The best measurement strategies don't just rely on numbers; they dig into the stories behind them. Hard data gives you proof, but qualitative feedback tells you why things are happening. This is where tools and techniques from analytics for HR can be incredibly valuable, as they focus on turning people-data into tangible business insights.
Choosing the right tool for the job is critical. This table breaks down common methods to help you decide what fits your goals.
Data Collection Methods for Training Measurement
Method | Best For Measuring | Pros | Cons |
|---|---|---|---|
Surveys & Quizzes | Reaction (Level 1) & Learning (Level 2) | Scalable, easy to deploy, and gives you clean quantitative data fast. | Can suffer from low response rates; may not reflect actual on-the-job application. |
Interviews & Focus Groups | Reaction (Level 1) & Behavior (Level 3) | Delivers deep, contextual insights and often uncovers unexpected issues or wins. | Time-intensive; results can be subjective and are harder to scale or quantify. |
Performance Data | Behavior (Level 3) & Results (Level 4) | Objective, directly tied to business goals, and highly credible with leadership. | Can be influenced by outside factors; sometimes requires pulling data from multiple systems. |
Direct Observation | Behavior (Level 3) | Provides undeniable evidence of skill application in a real-world context. | Can be biased (people act differently when watched); not scalable for large or remote teams. |
Ultimately, a mix is best. Use performance data to prove impact, then use interviews to understand why that impact happened.
Finding the Story in Your Data
Once you have the data, the real work starts. This isn't about throwing numbers into a spreadsheet; it's about connecting the dots to find the story. Look for correlations. Did the reps who scored highest on the post-training quiz also see the biggest drop in their average call handle time?
Scan for patterns in the feedback. If five different people mention that a specific module was confusing, that's a clear signal to go back and fix it. This is where a platform like Build a Guide can give you an edge, showing you engagement "hotspots" where people repeatedly pause or re-read something. It's a dead giveaway for confusion.
Improving the clarity of your content is a constant battle. For visual media, our guide on how to create training videos has some practical tips that can make a huge difference.
Calculating a Simple Return on Investment (ROI)
ROI sounds intimidating, but the basic formula is surprisingly simple. You don't need a finance degree to get a powerful number that speaks volumes to leadership.
ROI (%) = (Net Program Benefits ÷ Program Costs) x 100
Let's walk through a quick, realistic example:
Calculate Program Costs: Add everything up—the trainer's salary, software licenses, and the cost of employees' time away from their desks. Let's say it comes out to $10,000.
Quantify Program Benefits: This is the creative part. Imagine your training helped the support team cut their average handle time by 2 minutes per call. They handle 5,000 calls a month, so that’s 10,000 minutes saved. At an average wage of $30/hour, that translates to $5,000 in monthly savings, or $60,000 over a year.
Calculate Net Benefits: Just subtract the costs from your annual benefit: $60,000 - $10,000 = $50,000.
Calculate ROI: Now, plug it into the formula: ($50,000 ÷ $10,000) x 100 = a 500% ROI.
Suddenly, you can say, "For every dollar we invested in this training, we got five dollars back." That's a powerful statement.
While businesses pour over $80 billion into U.S. training annually, a shocking 87% of them admit they struggle to connect it to real business impact. This kind of simple financial proof is the ultimate way to show your work isn't just a cost center—it's a profit driver.
Using Data to Iterate and Improve Your Training
Collecting data on training isn't the finish line. It's the starting block for the next lap.
Measurement isn't just a report card to prove value. It's a roadmap that shows you exactly where to improve your training programs so they actually make a difference.
The most successful training initiatives are never "one and done." They are living projects that evolve based on real-world evidence. This means creating a continuous feedback loop where data becomes the fuel for every change you make.
Creating a Continuous Feedback Loop
A feedback loop is a simple but powerful concept. You launch a training program, measure its initial impact, analyze the results to find what’s not working, and use those insights to refine the content.
This cycle is what keeps your training relevant and effective long after launch day.
Think of it in two different speeds:
Short-Term Adjustments: These are quick fixes based on immediate feedback. Insights from Level 1 (Reaction) and Level 2 (Learning) metrics—like survey comments and quiz scores—are perfect for this. If a dozen people flag a specific module as confusing, you don’t wait for a quarterly review. You fix it now.
Long-Term Strategy: This is about the big picture. Level 3 (Behavior) and Level 4 (Results) data takes months to mature, but it’s what informs your broader strategy. If a six-month analysis shows that your new sales training hasn't moved the needle on deal size, it’s time to rethink the entire approach, not just tweak a slide.
This dual-speed approach lets you be both responsive and strategic, making small tweaks constantly while planning major overhauls based on proven business outcomes.
Measurement isn't about passing or failing; it's about learning and adapting. Every piece of data, whether it's a glowing review or a poor assessment score, is a valuable clue that guides your next move.
A Real-World Scenario of Data-Driven Iteration
Imagine a tech company rolls out training for its new internal software. They use analytics within their SOP platform to track engagement. The data shows that 90% of users complete the first three modules, but then there's a massive 70% drop-off at the start of module four—the one covering a critical data export function.
Without this data, the training team would be flying blind. But with it, they know exactly where the problem is.
Here’s how they use that insight to iterate:
Investigate the "Why": They conduct a few short interviews with employees who dropped off. They quickly learn the written instructions are unclear, and the screenshot doesn't match the updated user interface. Simple as that.
Implement Quick Fixes: The team immediately updates the screenshot and rewrites the instructions for clarity. They also add a simple, one-page checklist to the module that users can download.
Relaunch and Remeasure: They notify the team of the update. Within a week, completion rates for module four jump from 20% to 85%. More importantly, the IT department reports a 50% reduction in help tickets related to data exports.
This is the iterative process in action. The initial data didn't signal failure; it pointed to an opportunity. By acting on it, the company turned a frustrating roadblock into a smooth, effective part of their training.
Quantitatively measuring training allows organizations to achieve 10% average annual performance gains, outpacing non-measurers by a staggering 60%. This is because data provides concrete direction. For instance, post-training analysis often shows customer service ratings climbing 20% or technical error rates falling 22% after baseline comparisons. If you're documenting workflows, you might find that adding checklists can lead to 35% faster issue resolutions, directly measuring a change in on-the-job behavior. To learn more about creating effective documentation, check out our guide on how to create training manuals.
Treating your training like a product that needs constant improvement is the key to long-term success. It ensures your programs don't just launch with a bang but continue to deliver real, measurable value to both employees and the business. Explore more about the financial returns of this approach in this comprehensive report on training ROI.
Got Questions About Measuring Training? Let's Unpack Them.
Even with a solid plan, actually measuring training effectiveness can feel tricky. You run into practical questions that can stall the whole process.
Let's walk through the most common hurdles. These are the real-world issues that slow down even the best teams. Getting them right is the key to proving your training's worth.
How Often Should We Be Measuring This Stuff?
The short answer: it’s not a one-and-done deal.
A scattered approach won't give you a clear picture. You need a rhythm. Think of it as telling a story over time, with different checkpoints revealing more of the plot.
Effective measurement happens in waves:
Right After Training (1-3 days): This is your window for immediate feedback. Send out satisfaction surveys (Kirkpatrick's Level 1) and run knowledge checks (Level 2) while the experience is still fresh.
A Month or Two Out (30-90 days): Now you're looking for early signs that the training is sticking. Are people actually using the new skills on the job? This is the sweet spot for manager observations and self-assessments to see if behavior (Level 3) is changing.
The Long Game (6-12 months): This is where you see the payoff. It takes time for new behaviors to translate into business results (Level 4), so be patient. This is when you can analyze metrics like productivity gains, higher customer sat scores, or better employee retention.
We Have a Tiny Team and No Budget. What Can We Do?
You don't need a data science department to get started. Honestly, it's better to start small and focused anyway.
Key Takeaway: It's far better to measure one or two high-impact metrics well than to poorly track ten of them. Focus your limited resources where they can tell the most powerful story.
Here’s a lean, practical approach that works:
Pick One High-Impact Program: Don't try to measure everything. Choose a single, critical initiative. Maybe it's new hire onboarding or a crucial product update training.
Focus on One Business KPI: What’s the one business metric that training is supposed to move? For onboarding, that might be time-to-productivity. For a sales training, it could be the average deal size.
Use Free or Low-Cost Tools: You have more data than you think. Use Google Forms for surveys. Do quick, informal check-ins with managers. Pull existing performance data from systems you already use.
This focused approach keeps measurement from becoming overwhelming. It also helps you build a killer case study to justify more resources later.
How Can We Prove the Training Actually Caused the Improvement?
This is the million-dollar question. How do you isolate the impact of your training from all the other noise?
The gold standard here is using a control group.
A control group is simply a set of employees who don't get the training. By comparing their performance to the group that did, you can draw a much clearer line back to your program.
Let's make it real. Imagine you're rolling out a new de-escalation training for half of your customer support team.
The Trained Group: 20 reps go through the new training.
The Control Group: 20 reps continue working as usual, without the training.
Three months later, you look at the numbers. If the trained group shows a 15% decrease in escalated tickets while the control group's rate stays flat, you have a pretty compelling argument that your training worked.
When a formal control group just isn't possible, your next best bet is to establish a rock-solid baseline before you start. Track specific, closely-related metrics over time. The closer you can tie a new skill to a specific performance metric, the stronger your case will be.
Ready to turn your team’s knowledge into clear, measurable, and effective training guides? Build a Guide uses AI to transform screen recordings into polished SOPs with built-in analytics, so you can track engagement and prove your training's impact. Start creating guides that drive results today at https://buildaguide.app.